Particle-in-cell calculation
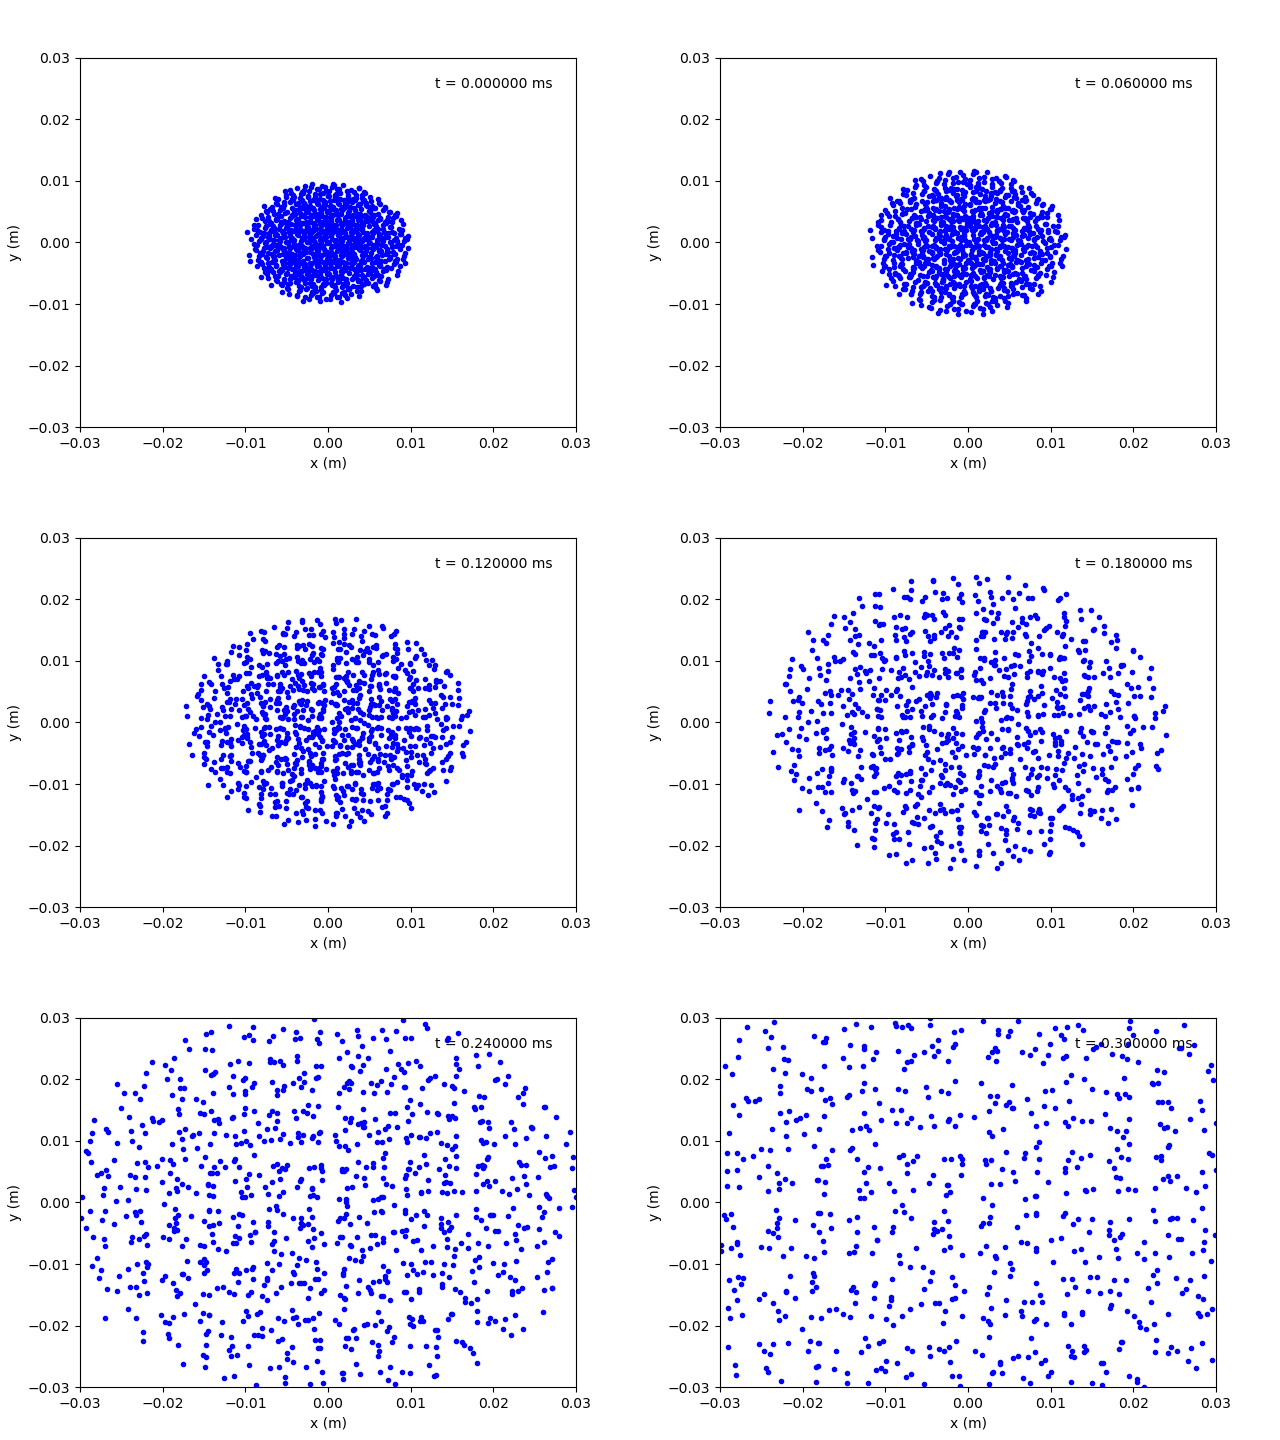
This example presents a simulation, where a sphere of 1000 1 e charges with mass of 1 u expands in a box using particle-in-cell or PIC technique. The initial radius of the sphere is 10 mm.
The key point here is that in a typical IBSimu simulation we are looking at "trajectories" that you can think of as continuous DC beamlets going continuously from their starting points to their ending points. Time does not really exist in such a simulation. In PIC simulations, on the other hand, the simulated point-like particles typically representing several real particles are iterated through time in small time steps. At each time step the charge distribution produces an electric field, which may affect the particles in addition to the electrode created fields.
The following snippet shows a main loop of a PIC simulation:
    double t = 0.0;
    double dt = 1e-6;
    i = 0;
    while( t < 0.3e-3 ) {
        pdb.step_particles( scharge, efield, bfield, dt );
        solver.solve( epot, scharge );
        efield.recalculate();

        i++;
        t = i*dt;
    }
The method allows one to change the electrode voltages as a function of time (electrostatic beam sweeping for example) or to model space charge forces of a beam bunch. The example presented here is as simple as possible and was used to demonstrate that the space charge force in the simulation has expected results.
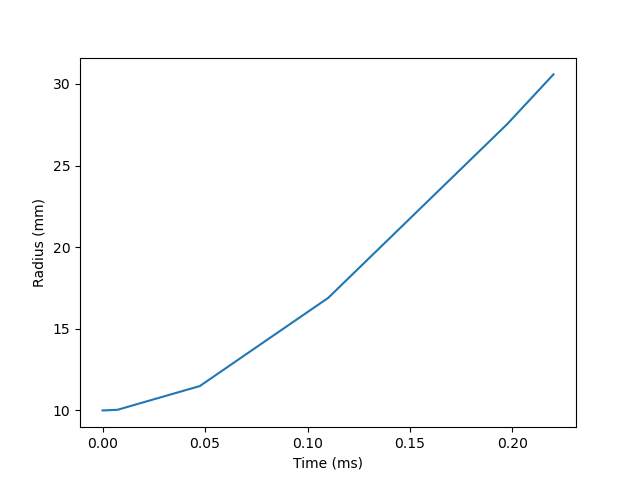
One can calculate that a spherical charge cloud produces a field (Gauss law) that provides an acceleration to a charge on the sphere edge: a = q*Q/(epsilon_0*4*pi*r^2*m)The acceleration can be integrated to show that in about 0.22 ms the charges on the edge reach a radius of 30 mm.

The same can be simulated with IBSimu with the PIC method. The computation produces the same behaviour.

The files:
- Makefile
- simu.cpp - a full example
- precalc.py - calculation of the expansion
- plot.py - plotter tool
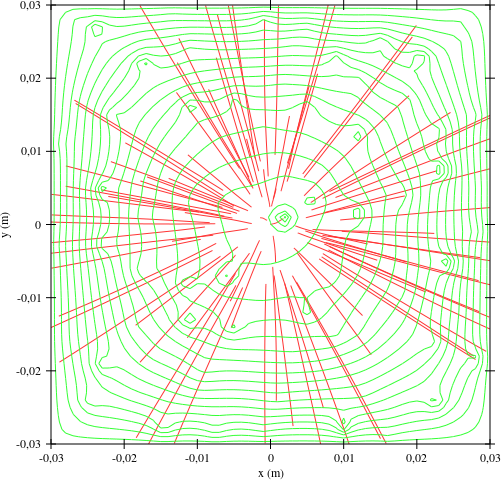
Please note that the PIC feature should be used with caution. Not a lot of testing has been done (as of June 2022). The interactive plotter is not intended for showing point-like particles and will have to be modified. For now, you can build scripts such as the ones presented here to plot particle locations at certain times. Currently for the presented example, the interactive plotter will show the field at the end of the simulation and particles as traces:

