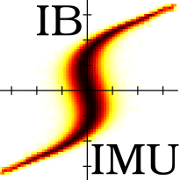
Power density plots on solid surfaces
For making plots of power density on solid surfaces, I have used the followng helper class:
struct Power {

    Transformation      t;
    std::vector<double> xdata;
    std::vector<double> ydata;
    std::vector<double> wdata;

    void add( const Particle3D &pp ) {
        Vec3D x = pp.location();
        Vec3D vel = pp.velocity();
        x = t.transform_point( x );
        xdata.push_back( x[0] );
        ydata.push_back( x[1] );
        double V = 0.5*pp.m()*vel.ssqr()/pp.q();
        wdata.push_back( pp.IQ()*V );
    }

    void plot( const std::string &filename ) {
        // Make histogram
        Histogram2D h( 51, 51, xdata, ydata, wdata );
        h.convert_to_density();
        // Output data
        ofstream ostr( filename.c_str() );
        for( size_t j = 0; j < h.m(); j++ ) {
            for( size_t i = 0; i < h.n(); i++ ) {
                ostr << setw(12) << h.icoord(i) << " "
                     << setw(12) << h.jcoord(j) << " "
                     << setw(12) << h(i,j) << "\n";
            }
            ostr << "\n";
        }
        ostr.close();
    }
};
The class gathers energy data from collided particles and transforms the coordinates from 3D collision point into a 2D plot plane. So first you need to make on object of the type Power and define the translation:
Power power;
power.t.translate( Vec3D(0.008486,0,-0.053258) );
power.t.rotate_y( atan(55.71/153.05) );
You should go through the particle collision points and select the ones which are interesting feeding those to power:
// Go through particle end locations
for( size_t i = 0; i < pdb.size(); i++ ) {

    // Particle location
    Particle3D &pp = pdb.particle( i );

    // Not interesting location
    if( pp[PARTICLE_Z] < 37.0e-3 ||
        pp[PARTICLE_Z] > 60.0e-3 ||
        pp[PARTICLE_X] > 0.0e-3 )
        continue;

    power.add( pp );
}
Then as a last thing, plot out the data to an ASCII file:
power.plot( "power.txt" );
