Navigation
Main Page
Download
Support
Installation
Tutorial
Examples
Reference Manual
Version 1.0.5new_solver
Version 1.0.5dev
Version 1.0.5b
Class Index
File List
Version 1.0.4dev
Version 1.0.4
Publications
Hosted by
FieldGraph Class Reference
Class for drawing fields with colormap. More...
#include <fieldgraph.hpp>
Public Member Functions | |
| FieldGraph (const ScalarField *field) | |
| Constructor for plotting ScalarField. | |
| FieldGraph (const Geometry *geom, const VectorField *field, field_type_e field_type) | |
| Constructor for plotting a VectorField field in geometry geom. | |
| virtual | ~FieldGraph () |
| Destructor. | |
| void | enable (bool enable) |
| Enable/disable plot. | |
| void | set_stepped_palette (int steps) |
| Set logarithmic scale. | |
| virtual void | plot (cairo_t *cairo, const Coordmapper *cm, const double range[4]) |
| Plot graph with cairo. | |
| virtual void | plot_sample (cairo_t *cairo, double x, double y, double width, double height) |
| Plot sample for legend. | |
| virtual void | get_bbox (double bbox[4]) |
| Get bounding box of drawable. | |
Detailed Description
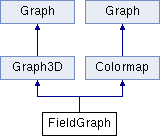
Class for drawing fields with colormap.
Implementation of Graph3D. Used in Frame type plots.
Constructor & Destructor Documentation
| FieldGraph::FieldGraph | ( | const ScalarField * | field | ) |
Constructor for plotting ScalarField.
| FieldGraph::FieldGraph | ( | const Geometry * | geom, | |
| const VectorField * | field, | |||
| field_type_e | field_type | |||
| ) |
Constructor for plotting a VectorField field in geometry geom.
| virtual FieldGraph::~FieldGraph | ( | ) | [virtual] |
Destructor.
Member Function Documentation
| void FieldGraph::enable | ( | bool | enable | ) |
Enable/disable plot.
| virtual void FieldGraph::get_bbox | ( | double | bbox[4] | ) | [virtual] |
Get bounding box of drawable.
Returns the bounding box of the drawable in array bbox in order xmin, ymin, xmax, ymax.
Reimplemented from Colormap.
| virtual void FieldGraph::plot | ( | cairo_t * | cairo, | |
| const Coordmapper * | cm, | |||
| const double | range[4] | |||
| ) | [virtual] |
| virtual void FieldGraph::plot_sample | ( | cairo_t * | cairo, | |
| double | x, | |||
| double | y, | |||
| double | width, | |||
| double | height | |||
| ) | [virtual] |
Plot sample for legend.
Plot graph sample for legend at cairo coordinates x.
Reimplemented from Colormap.
| void FieldGraph::set_stepped_palette | ( | int | steps | ) |
Set logarithmic scale.
Set stepped palette. If steps is less than or equal to 1 a regular interpolated palette will be used, otherwise steps is used as the number of separate shades in the palette.
The documentation for this class was generated from the following file: