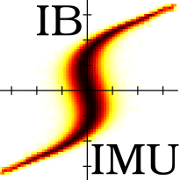
Class for XY-type simple graph plots. More...
#include <xygraph.hpp>

Public Member Functions | |
| XYGraph () | |
| Default constructor for empty graph. More... | |
| XYGraph (const std::vector< double > &xdata, const std::vector< double > &ydata) | |
| Constructor for basic graph with datapoints xdata and ydata. More... | |
| virtual | ~XYGraph () |
| Destructor. More... | |
| virtual void | plot (cairo_t *cairo, const Coordmapper *cm, const double range[4]) |
| Plot graph with cairo. More... | |
| virtual void | plot_sample (cairo_t *cairo, double x, double y, double width, double height) |
| Plot sample for legend. More... | |
| virtual void | get_bbox (double bbox[4]) |
| Get bounding box of graph. More... | |
| void | set_data (const std::vector< double > &xdata, const std::vector< double > &ydata) |
| Set new data arrays. More... | |
| void | set_line_width (double linewidth) |
| Set line width. More... | |
| void | set_color (const Vec3D &color) |
| Set graph color. More... | |
| void | set_line_style (line_style_e linestyle, double linewidth=1.0) |
| Set line style. More... | |
| void | set_point_style (point_style_e pointstyle, bool filled=true, double scale=1.0) |
| Set point style. More... | |
| void | set_histogram (bool histo) |
| Set histogram style. More... | |
| void | extend_histogram (bool extend) |
| Extend histogram. More... | |
 Public Member Functions inherited from Graph Public Member Functions inherited from Graph | |
| virtual | ~Graph () |
| Virtual destructor. More... | |
Detailed Description
Class for XY-type simple graph plots.
Implementation of Graph. Used in Frame type plots.
Constructor & Destructor Documentation
◆ XYGraph() [1/2]
| XYGraph::XYGraph | ( | ) |
Default constructor for empty graph.
◆ XYGraph() [2/2]
| XYGraph::XYGraph | ( | const std::vector< double > & | xdata, |
| const std::vector< double > & | ydata | ||
| ) |
Constructor for basic graph with datapoints xdata and ydata.
Internal copies of the data from xdata and ydata are made.
◆ ~XYGraph()
|
inlinevirtual |
Destructor.
Member Function Documentation
◆ extend_histogram()
| void XYGraph::extend_histogram | ( | bool | extend | ) |
Extend histogram.
Set to true for histogram to be extended in x-direction to cover all of range.
◆ get_bbox()
|
virtual |
Get bounding box of graph.
Returns the bounding box of the graph in array bbox in order xmin, ymin, xmax, ymax.
Implements Graph.
◆ plot()
|
virtual |
◆ plot_sample()
|
virtual |
◆ set_color()
| void XYGraph::set_color | ( | const Vec3D & | color | ) |
Set graph color.
Defaults to red (1,0,0).
◆ set_data()
| void XYGraph::set_data | ( | const std::vector< double > & | xdata, |
| const std::vector< double > & | ydata | ||
| ) |
Set new data arrays.
◆ set_histogram()
| void XYGraph::set_histogram | ( | bool | histo | ) |
Set histogram style.
Set to true for histogram style plots.
◆ set_line_style()
| void XYGraph::set_line_style | ( | line_style_e | linestyle, |
| double | linewidth = 1.0 |
||
| ) |
Set line style.
Defaults to no lines drawn (XYGRAPH_LINE_DISABLE)
◆ set_line_width()
| void XYGraph::set_line_width | ( | double | linewidth | ) |
Set line width.
Default to width 1.0.
◆ set_point_style()
| void XYGraph::set_point_style | ( | point_style_e | pointstyle, |
| bool | filled = true, |
||
| double | scale = 1.0 |
||
| ) |
Set point style.
Defaults to filled XYGRAPH_POINT_CIRCLE with scale 3.0.
The documentation for this class was generated from the following files:
